Поиск скриптов по запросу "Buy sell"

ZenTrend Follower Signals (Backtest)Buy/Sell Entry signals based on the ZenTrend Follower indicator.
Entries are taken from the setup and trend breakout level, exits from the trailing stop loss.
Overextension and trend re-entry signals are ignored.
The indicator is linked below
If you enjoy these posts please like and subscribe so more people can join you :)
If you want to tryout the indicator and strategy, follow me and drop a comment or pm and I’ll get you set up.
Stay calm, and happy trading!
More information on the indicator can be found below:

Altcoins StrategyBuy/Sell Altcoins strategy. Based on moving averages, divergences, price and volume

Buy SellKıvanc hocanın yazdığı 2 stop loss indikatörünün birleşmesi sonucu bulundu. Çalışma mantığını kullandıkça anlayacaksınızıdır.


Buy Sell signal by Spicytrader
Get on board before going to the moon !
Spicytrader instantly identifies when a potential pump or dump is beginning.
Compatible with Autoview bot
GET ACCESS : spicytrader.com


Buy/Sell Using MACD and ReversalsUsing the crossover of Signal Line and MACD line predict the reversals of trends in the chart.


Buy/Sell Ahmed Rashiedtrade with confidence good for both intra day and long term took me 2 yrs to finish it

MULTIPLE TIME-FRAME STRATEGY(TREND, MOMENTUM, ENTRY) Hey everyone, this is one strategy that I have found profitable over time. It is a multiple time frame strategy that utilizes 3 time-frames. Highest time-frame is the trend, medium time-frame is the momentum and short time-frame is the entry point.
Long Term:
- If closed candle is above entry then we are looking for longs, otherwise we are looking for shorts
Medium Term:
- If Stoch SmoothK is above or below SmoothK and the momentum matches long term trend then we look for entries.
Short Term:
- If a moving average crossover(long)/crossunder(short) occurs then place a trade in the direction of the trend.
Close Trade:
- Trade is closed when the Medium term SmoothK Crosses under/above SmoothD.
You can mess with the settings to get the best Profit Factor / Percent Profit that matches your plan.
Best of luck!

[STRATEGY][RS]MicuRobert EMA cross V2Great thanks Ricardo , watch this man . Start at 2014 December with 1000 euro.


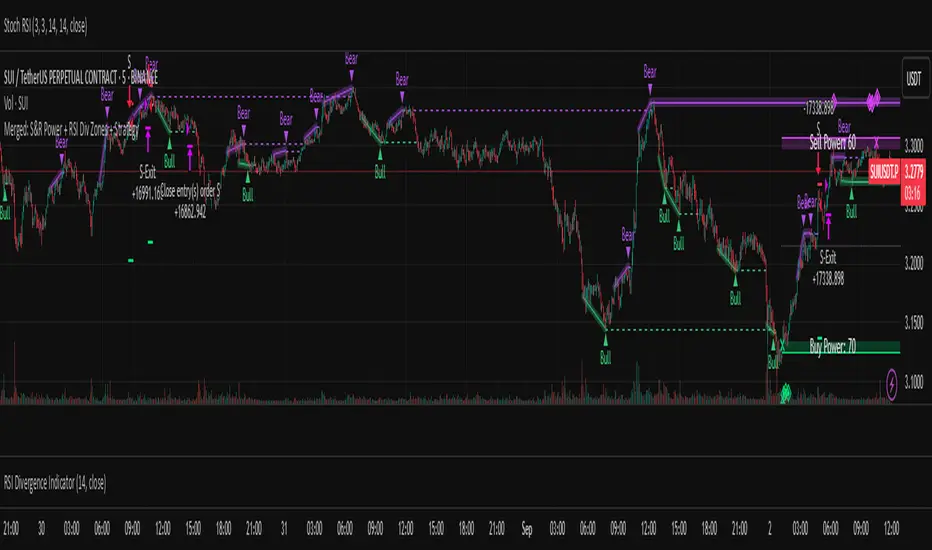
Merged: S&R Power + RSI Div Zones + StrategyS&R Power + RSI Divergence Zones (ChartPrime) into a single, rules-based TradingView strategy. The goal: take a visually appealing idea and make it testable, configurable, and automatable — with explicit entries, filters, and exits.
Concept
• Module 1: S&R Power (zones + Buy/Sell Power, channel height).
• Module 2: RSI Momentum Divergence Zones (bull/bear divergence levels).
• Entry logic uses the latest divergence “zone” as the actionable price level, while Module 1 provides context/filters (power thresholds, channel height, optional confirmation).
Entries
• Long: when price tags the most recent bullish divergence level.
• Short: when price tags the most recent bearish divergence level.
• Optional “wait window” (in bars): if filters aren’t met immediately, the strategy can keep listening for a qualified entry for a limited time after the initial signal.
Filters (toggleable, per side)
• Touching Buy/Sell Power zones from Module 1.
• Optional “confirmation diamond” emulation from Module 1.
• Minimum Buy Power (for longs) / Minimum Sell Power (for shorts).
• Minimum channel height (%) to avoid trading inside very narrow ranges.
• Power difference threshold: (Buy − Sell) for longs, (Sell − Buy) for shorts.
Exits & Risk
• Separate TP/SL for longs and shorts (percent-based).
• Reaction to opposite signal while in position: None, Close, or Reverse (configurable per side).
• No pyramiding (pyramiding=0). Guide lines plot entry/TP/SL for clarity.
Repainting & Confirmation Notes
• Visual elements from Module 1 can repaint historically. This strategy avoids relying on repaint-prone shapes by (a) triggering on confirmed divergence levels from Module 2, and (b) gating entries with filters and a wait window.
• Divergence detection uses pivots and lookbacks; a divergence is considered only once it satisfies the lookback conditions (barstate.isconfirmed in the signal logic).
Inputs Overview
• Strategy Settings: TP/SL for long/short, guide line length, max guides, behavior on opposite signal (None/Close/Reverse).
• Filters & Waiting: wait bars after signal, power zone checks, confirmation option, power thresholds, channel height %, power difference thresholds.
• Indicator 1 — S&R Power: length, extend, colors.
• Indicator 2 — RSI Divergence Zones: RSI length, show divergence zones, number of stored zones, bull/bear colors.
How to Use
Add to chart on your desired symbol/timeframe.
Tune “Filters & Waiting” to your market conditions (e.g., increase channel height % to skip flat).
Set Buy/Sell Power thresholds and power difference to control selectivity.
Choose how the strategy reacts to opposite signals (None/Close/Reverse).
Adjust TP/SL per side, and set commission/slippage in Strategy Properties to match your venue.
Good Practice
• Forward-test in live conditions; do not rely solely on backtests.
• Commission/slippage matter; set realistic values in properties.
• Different assets/timeframes may need different thresholds for power and channel height.
Credits & Disclaimer
• Built on ideas from two ChartPrime indicators (S&R Power and RSI Momentum Divergence Zones). Not affiliated with ChartPrime.
• For educational purposes only. This is not financial advice. Trade responsibly with proper risk management.
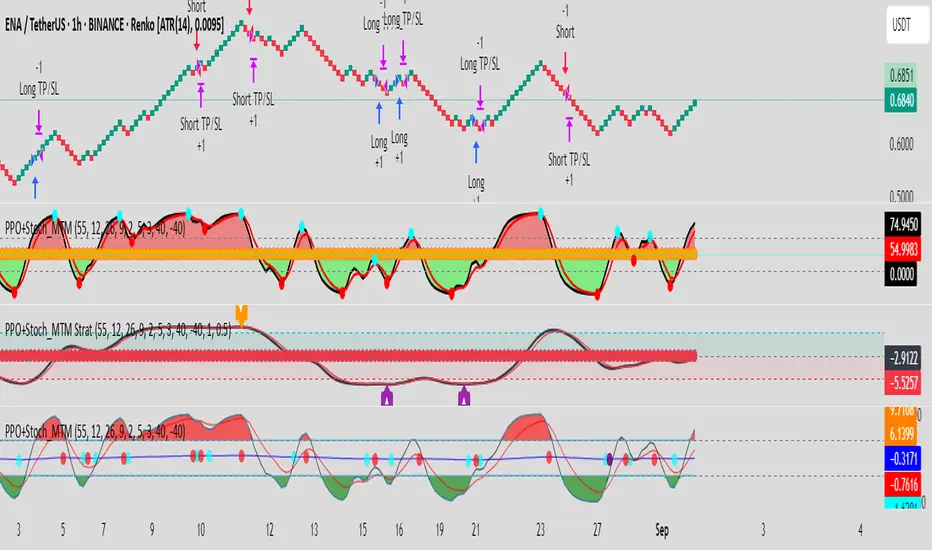
PPO+Stoch_MTMPPO + Stoch_MTM (SMI) — Description
Version: Pine v6
What this indicator does
Computes a PPO (Percentage Price Oscillator) and a smoothed SMI-like stochastic (Stoch_MTM), plots both and their signals in one pane.
Shows histogram of PPO momentum (PPO − PPO signal), SMI (K) and SMI signal (D).
Detects and marks simple bullish / bearish divergences on SMI and PPO (visual lines + markers).
Draws SMI pivot tops / bottoms (small crosses) for structure reference.
Optionally fills the area above/below zero for quick buy/sell zone visualization.
Default inputs (exposed)
Use long term Divergences? = true
Lookback Period = 55
PPO: Fast Length = 12, Slow Length = 26, Signal Length = 9, Smoother = 2
SMI: Percent K Length = 5, Percent D Length = 3
Overbought = 40, Oversold = −40
Toggle options: show/hide PPO plots, SMI plots, divergences, pivots, and SMI zone fill
Plots & visuals
PPO (line), PPO signal (line), PPO histogram (columns)
SMI K (black line) and SMI D (red line)
Overbought / Oversold levels (dashed lines) and zero line (dotted)
Colored semi-transparent fill: green when SMI > 0, red when SMI < 0 (optional)
Divergence lines: purple for bullish, orange for bearish (drawn between indicator swings)
Markers: small labeled shapes for BUY / SELL triggers (basic cross confirmations)
Buy / Sell signal logic (default example)
Buy: PPO histogram > 0 and SMI crosses above SMI signal (simple confirmation)
Sell: PPO histogram < 0 and SMI crosses below SMI signal
Divergences and pivots are visual aids — combine with price action and risk rules.
How to use (practical notes)
Use longer timeframes or appropriately sized Renko bricks for reduced whipsaw; this indicator is an oscillator, not a standalone order system.
Treat divergence lines as early warning / context — validate with price structure (higher highs / lower lows).
Use the show/hide toggles to declutter the pane depending on your workflow.
Add alerts on the BUY/SELL signal shapes or custom alertcondition(...) if you want push/WebHook alerts.
Limitations & risks
Not a guarantee of profitability — oscillators produce false signals in strong trends or during low liquidity.
Divergence detection is simplified to be robust and fast; proprietary divergence engines may behave differently.
Backtest any rule set before live trading; apply position sizing and risk controls.
Recommended quick start
Add indicator to chart with defaults.
Test visually on 1H / 4H (or Renko charts scaled to ATR-based brick) to see signal behaviour.
Use PPO histogram + SMI K/D cross for entry signals; require price structure confirmation for trade entry.
Add stop-loss (recent swing low/high) and fixed risk per trade (e.g., 0.25–1% equity).
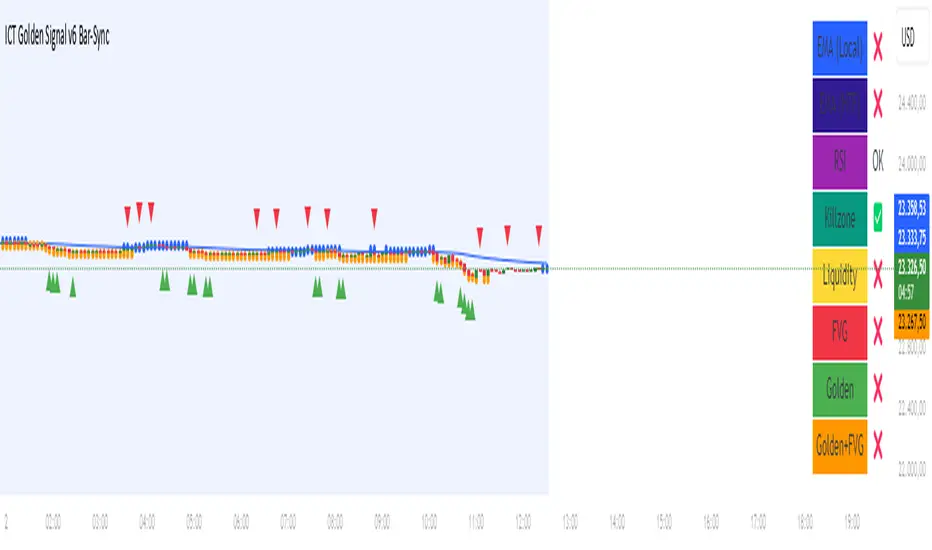
ICT Golden Signal v6 Bar-Sync1️⃣ EMA (Exponential Moving Average)
Blue line: Local EMA (50 periods).
Dashboard: “EMA (Local)” → ✅ price above EMA, ❌ below EMA.
HTF EMA (1H): Shows higher timeframe trend, displayed in the dashboard.
Meaning:
Price above EMA → overall trend is up.
Price below EMA → overall trend is down.
2️⃣ RSI (Relative Strength Index)
RSI Overbought / Oversold levels: 70 and 30.
Dashboard:
OB → RSI is overbought
OS → RSI is oversold
OK → normal range
Meaning:
RSI crossing above OS → potential buy signal.
RSI crossing below OB → potential sell signal.
3️⃣ Equal High / Equal Low (Liquidity Levels)
Orange line: Equal Low (equal bottoms)
Blue line: Equal High (equal tops)
Yellow arrows / plotchar:
▲ Break below bottom → possible Stop Hunt Short
▼ Break above top → possible Stop Hunt Long
Meaning:
These are liquidity collection points in the market.
Stop Hunt may occur here → prerequisite for Golden Signal.
4️⃣ Fair Value Gap (FVG)
Green ▲ → FVG upward (buy opportunity)
Red ▼ → FVG downward (sell opportunity)
Dashboard “FVG” → ✅ price is within FVG, ❌ outside
Meaning:
Market often fills the price gap.
Golden Signal + FVG → strong entry opportunity.
5️⃣ Killzones
London: 03:00–05:00
New York: 08:30–10:30
Dashboard → ✅ trading session active, ❌ outside session
Meaning:
Strategy only generates signals during killzones.
Signals outside these times are ignored.
6️⃣ Entry and Golden Signals
B (green) → normal Long Entry
S (red) → normal Short Entry
★ (lime/maroon) → Golden Long / Short
🔥 (teal/purple) → Golden + FVG
Meaning:
Golden Signal → Stop Hunt + EMA trend + RSI conditions met.
Golden + FVG → top-level buy/sell opportunity, very strong signal.
7️⃣ Dashboard
Top-right table shows all indicator conditions at a glance:
EMA local / HTF
RSI status
Killzone status
Liquidity (Stop Hunt)
FVG status
Golden & Golden + FVG status
Benefit:
You can quickly see all information in one place instead of searching through the chart.
Summary
Trend determined by EMA.
Momentum checked with RSI.
Equal High/Low → liquidity and Stop Hunt points.
FVG → price gaps.
Killzones → signals only during certain hours.
Golden / Golden + FVG → strongest entry opportunities.
Dashboard → all signals and conditions at a glance.
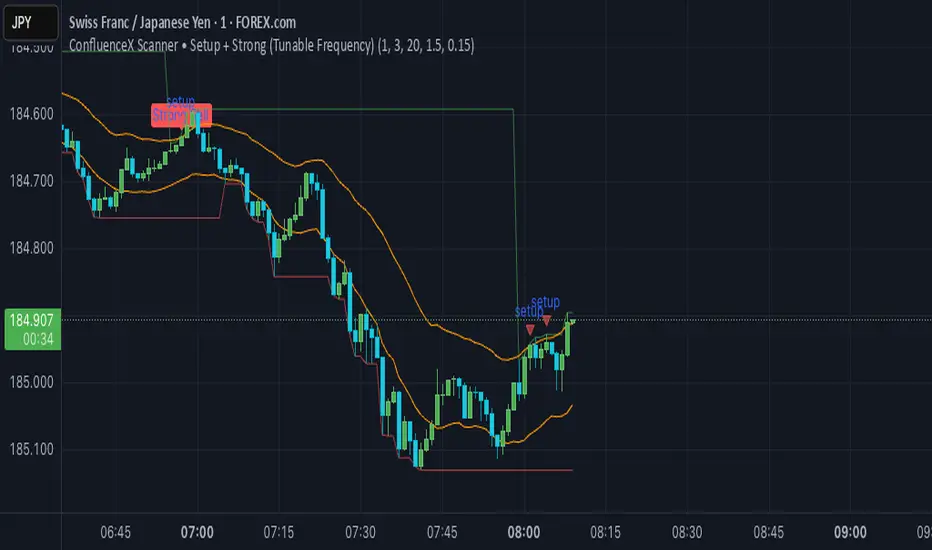
ConfluenceX Telegram AlertsThis script connects ConfluenceX trading setups directly to Telegram.
Built on a mix of Keltner Channel breakouts, stochastic extremes, and support/resistance zones.
Generates Setup Alerts when price approaches key levels.
Triggers Strong Buy/Sell Alerts when multiple confluences align.
Optimized for M1, M5, M15, M30, H1 timeframes.
Compatible with forex, crypto, and stocks.
Use this script to automate TradingView alerts and receive them instantly on your phone via Telegram.